As we head into the world cup break, now is an ideal time to take a look at WhoScored to find out how United’s players compare to the team of the season in the Championship so far.
I will be publishing this topic as a series throughout the week giving a comparison in a number of significant metrics for all positions.
Team Of The Season – Goalkeeper:
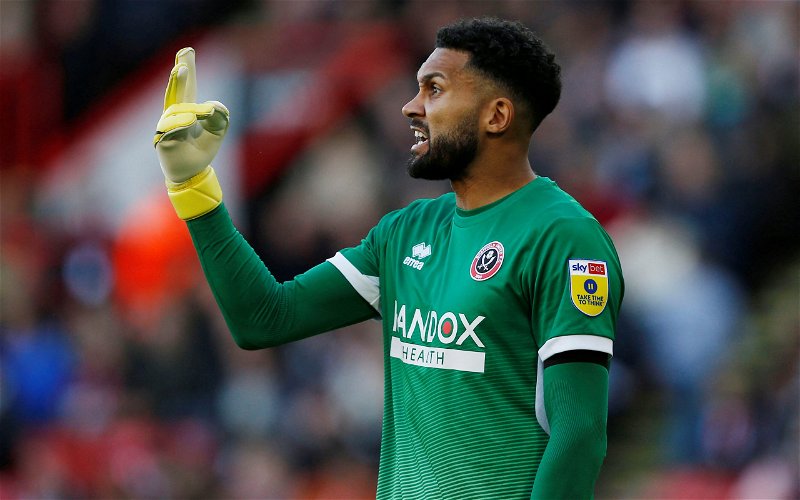
Viktor Johannson vs Wes Foderingham
Johannson has been excellent between the sticks for the Millers this season and United faced him just recently when he kept a clean sheet in Rotherham’s 1-0 win at Bramall Lane.
Johannson’s clean sheet percentage isn’t the best with 33.3% and compared to Wes Foderingham’s 44.4%.
The Rotherham United keeper has the best save percentage in the league with 78.8% versus 64.4% for Foderingham.
Also, Johannson faces more than double the shots on target per game than Foderingham does. Johannson faces 5.38 shots on target per game compared to 2.5 for Foderingham.
Both goalkeepers are good at commanding their area as we can see by their cross-stop percentage per game, Foderingham successfully stops 8.1% of crosses per game, whilst Johannson stops 8%.
An interesting goalkeeping metric to look at is the post-shot expected goals minus goals allowed (PSxG+/-). This metric measures the quality of a keeper’s shot-saving ability, and the more positive the number is it equates to being a better shot-stopper.
Johannson’s PSxG+/- number is +0.9 compared to Foderingham’s -1.3.
Neither goalkeeper have a great % when launching the ball from in play (40+ yard passes), with both registering a 29% launch completion.
Foderingham is the 3rd-best goalkeeper when it comes to goals conceded per game, boasting a number of 0.9. Johannson’s is 1.2 goals conceded per game.
